Testing for equivalence of test data across media
 In 2009, I wrote a small chapter that was part of an EU conference book on the transition to computer-based assessment. Now and then I’m coming back to this piece of work - in my teaching and my publications (e.g., the EJPA paper on testing reasoning ability across different devices). Now I want to make it publically available. Hopefully, it will be interesting to some of you. The chapter is the (unaltered) preprint version of the book chapter, so if you want to cite it, please use the following citation:
Schroeders, U. (2009). Testing for equivalence of test data across media. In F. Scheuermann & J. Björnsson (Eds.), The transition to computer-based assessment. Lessons learned from the PISA 2006 computer-based assessment of science (CBAS) and implications for large scale testing (pp. 164-170). JRC Scientific and Technical Report EUR 23679 EN.
Abstract
In order to stay abreast of social and technological changes and to capitalize on potential advantages of computer-based over paper-pencil testing, researchers are – in a first step of this transition process – concerned with moving already existing psychometric measures to computers. Therefore, testing for equivalence of a measure across test media becomes important in understanding whether computerizing measures affect the assessment of the underlying construct positively or adversely. In practical terms during the transition period equivalence is crucial in order to guarantee the comparability of test data and therewith the fairness for the test takers across media. After defining the term equivalence the available empirical evidence and proper statistical methods are discussed. It is argued that confirmatory factorial analysis is the soundest statistical tool for equivalence comparisons. The chapter concludes with some practical advices on what to do in order to adequately support the claim that a measure is equivalent across test media.
Introduction
Given the potential advantages of computer-based testing (CBT) over paper-pencil-testing (PPT) - like computer adaptive testing (CAT, see Thompson & Weiss, this volume) or the potential to reduce costs of testing (see Latour, this volume) – educational and psychological testing is transferred considerably to a new test medium. Besides large scale studies (e.g., NAEP, see Bridgeman; CBAS, see Haldane, both this volume) there is a variety of small scale studies. In an initial step researchers are concerned to transfer readily available paper-based measures to computers. Subsequently, opportunities provided by the new test medium like multimedia extensions might catch a researcher’s interest and trigger additional changes of the instrument. These two trends reflect two different research strategies. This chapter addresses data analytic issues in the first research strategy, primarily, the issue of equivalence of measures across test media, and is divided into three sections: (A) What is equivalence?, (B) Is there equivalence?, and (C) How to test for equivalence? The chapter concludes with some practical recommendations on how to achieve equivalence.
(A) What is equivalence?
Searching for the term equivalence in the “Standards for educational and psychological testing” (AERA, APA, & NCME, 1999) you will find several passages dealing with the issue. In the paragraphs about test administration (p. 62), score comparability (p. 57), and fairness of testing (p. 73) equivalence is immanent, but could easily be replaced by different labels like “unbiasedness” or “test fairness”. We will use the term “equivalence” following this working definition: The scores of measures are equivalent if they capture the same construct with the same measurement precision, providing interchangeable scores for individual persons. This definition suggests that two measures are equivalent if they are strict parallel, that is, test scores of such measures are solely dependent on the latent ability dimension and independent of test administration. Equivalence is given if the underlying source of all within group variance also accounts for the complete variance between the groups (PP vs. PC). Thus, equivalence is accurately described as measurement invariance (Drasgow & Kanfer, 1985). As we will see later on, there are different types of equivalence or measurement invariance. The next section will shed some light on the question whether evidence for equivalence can be found in the literature of educational and psychological testing.
(B) Is there equivalence?
Numerous studies try to clarify the question of equivalence across test media with respect to a) a specific measure (e.g., the computerized GRE, Goldberg & Pedulla, 2002), b) specific subgroups of testees (e.g., ethnic or gender groups, Gallagher, Bridgeman, & Cahalan, 2002) or c) specific soft- and hardware realizations (e.g., pen-based computer input, Overton, Taylor, Zickar, & Harms, 1996). However, the findings of these studies often remained unconnected and inconclusive. Mead and Drasgow (1993) attempted to connect these individual findings in their frequently cited – but by now outdated – meta-analytical study. Their synopsis endorses the structural equivalence of ability test data for power tests gathered through CBT versus PPT. The cross-mode correlation corrected for measurement error was r = .97 whereas this coefficient was only r = .72 for speed tests. The authors argue that the reason for the low cross-mode correlation among speed tests is substantiated in different motor skill requirements and differences in presentation (instructions, presenting of the items). By adjusting the requirements of a CBT to a PPT both artifacts should be eliminated and equivalence should be established. Consistent with this suggestion, Neuman and Baydoun (1998) demonstrated that the differences across media can be minimized for clerical speed tests if CBT follows the same administration and response procedures as PPT. The authors concluded that their tests administered on different media measure the same construct but with different reliability.
Kim (1999) presented a comprehensive meta-analysis featuring two enhancements over Mead and Drasgow’s earlier work: First, the sample of 51 studies including 226 effect sizes was more heterogeneous including studies on classroom tests and dissertations. Second, the authors corrected for within-study dependency in effect size estimation using a method recommended by Gleser and Olkin (1994), thus, avoiding both the overrepresentation of studies with many dependent measures and the inflation of false positive outcomes. According to Kim, in a global evaluation of equivalence of computer-based vs. paper-based tests the most important distinction concerns CAT vs. CBT. For CAT, mathematics and sort of publication are significant moderators in predicting the effect size, however, considering CBT alone no significant moderators could be found.
In the recent past, two more meta-analyses (Wang, Jiao, Young, Brooks, & Olson, 2007, 2008) for mathematics and English reading comprehension respectively for K-12 students cover the research results of the last 25 years. For mathematics 14 studies containing 44 independent data sets allowed a comparison of the scores from PPT and CBT measures. After excluding six data sets contributing strongly to deviance in effect size homogeneity the weighted mean effect size was statistically not different from zero. One moderator variable, the delivery algorithm (fixed vs. adaptive) used in computerized administration, contributed statistically significant to the prediction of the effect size, whereas all other moderator variables investigated (study design, grade level, sample size, type of test, Internet-based testing, and computer practice) had no salient influence. For English reading assessment the weighted mean effect size was also not statistically different from zero after excluding six from 42 datasets extracted from eleven primary studies in an attempt to eliminate effect size heterogeneity. In comparison to the meta-analysis in mathematics, the moderator variables differ: Four moderator variables (study design, sample size, computer delivery algorithm, and computer practice) affected the differences in reading comprehension scores between test media and three other postulated moderator variables (grade level, type of test, and Internet-based testing) had no statistically meaningful influence. Even though, on a mean level no differences between test media could be found for mathematic and reading comprehension, the postulation of differential moderator variables for both disciplines might indicate a capitalization on chance or the relevance of unconsidered moderators (e.g., year of the study). Obviously the small sample of studies in both domains limits the generalizability of the results.
Considering all evidence presented so far, the effects of the test medium on test performance are nil or small. However, meta-analyses on the equivalence of ability measures across test media have a conceptual flaw. In order to allow an adequate assessment of the equivalence of test data across administration modes a comparison of mean scores (and dispersions) is insufficient. Let us explain this point in more detail.
Horkay, Bennett, Allen, and Kaplan (2005) compared the performance of two nationally representative samples in a recent National Assessment of Educational Progress (NAEP) study in writing. One sample took the test on paper, the other sample worked on a computerized version. Albeit, means in both conditions were roughly the same, computer familiarity (consisting of a) hands-on computer proficiency, b) extent of computer use, and c) computer use for writing) added about 11% points over paper writing score to the prediction of writing performance in the PC-condition. Thus, students with greater hands-on skill achieved higher PC-writing scores when holding constant their performance on a paper-and-pencil writing test. Importantly, this difference in the construct measured by both instantiations would have remained undetected if the evaluation was solely based on tests of mean differences. So how does an appropriate procedure to test for equivalence between paper-based and computer-based measures look like?
(C) How to test for equivalence?
Let us begin with the distinction between within- and between-subjects-designs in the context of cross-media-equivalence. Within the former the same subjects work both on paper and computer, within the latter different groups of subjects work either on paper or on computer. In both cases a potential test medium effect cannot be established by comparing or analyzing mean differences of the manifest or the latent scores. Strategies often applied in literature are based on the tacit assumption that the sources of within- and cross-media variance are actually the same. However, this assumption has to be tested by analyzing the means, variances and the covariances of the data. For the reflective measurement models used predominantly in educational and psychological measurement, the framework of confirmatory factor analysis (CFA) provides the best method for equivalence testing. In CFA the communality of many manifest variables is explained through a smaller number of underlying latent factors. This is achieved by, first, reproducing the covariance structure of the observed variables with the postulated covariance of a theoretical driven model, and second, evaluating the fit of the variable-reduced model to the empirical data. In case of a within-subject-design, the logic of testing is to check whether or not an additional, test medium specific factor accounts for unexplained variance and affects model fit beneficially. In case of a between-subject-design between-group comparisons and within-group comparisons are possible (for a detailed discussion see Lubke, Dolan, Kelderman, & Mellenbergh, 2003) by using multi-group confirmatory factor analysis (MGCFA).
Imagine the following within-subject-scenario: Subjects are tested on three different media (paper-pencil, notebook-computer, personal digital assistant (PDA)) with three reasoning tests covering the content domains verbal, numerical, and figural. The items might vary across media but could be considered as drawn from an item universe with equally constrained random selection. After completing the three tests on one medium subjects continue with the next medium. Ideally, the reasoning tests are parallel in difficulty and no learning effects occur between the tests. Sequence effects are controlled by having an additional between-groups factor in the design controlling for the six different sequences. As mentioned before, in order to test for equivalence in this example of a within-subject-design, first, a theoretical-based structural model has to be established. In our case this could be a model with three correlated content-specific-reasoning factors (verbal, numerical, figural) or a g-factor model (cp. Wilhelm, 2005). Through the introduction of a nested test medium factor one can try to tap construct-irrelevant variance in the covariance structure. Because the derived model with the nested medium-factor is nested within the original model (Bollen, 1989) the difference in model fit can be assessed with a conventional Chi-square-difference test.
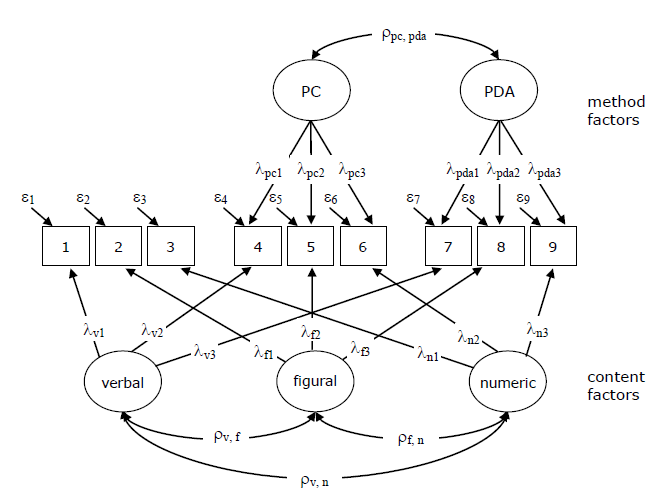
Figure 1. Correlated-trait-correlated-method-minus-one-model (CTC(M-1)-model)
In the multi-trait-multi-method-context different modeling strategies have been proposed to take method-specific variance – like the variance due to a test medium – into account. Figure 1 depicts a model with three traits and three methods – measured with nine indicators totally. Correlation within both traits and methods are allowed, but correlations between traits and methods are restricted to zero. Depending on theoretical considerations a number of competing models could be postulated, for instance, a correlated-trait-uncorrelated-method-model (CTUM-model, Marsh & Grayson, 1995). In case of inconsistent method artifacts on the indicators or an influence that is not unidimensional correlated errors should substitute method factors, resulting in two possible models: correlated-trait-correlated-uniqueness-model (CTCU-model) and the uncorrelated-trait-correlated-uniqueness-model (UTUC-model, Widaman, 1985). In order to solve identification problems with the CTCM model Eid (2000; Eid, Lischetzke, Nussbeck & Trierweiler, 2003) proposed the correlated-trait-correlated-method-minus-one-model (CTC(M-1)-model). In this model one method is chosen as a reference that is excluded from modeling. This implies that the method factors have to be interpreted in comparison to the reference method. In our example it would probably be sensible to choose the paper-pencil-condition as a reference method because we want to establish whether computers make a difference in comparison to the traditional method of using paper-based measures. Both method factors are correlated and this correlation could be interpreted as a computer-literacy-method factor that is orthogonal to the other factors in this model. One advantage of the CTC(M-1)-model is that the variance is totally decomposed into a trait-specific, a method-specific, and an error component. One disadvantage of this model architecture might be that content and method factors are expected to be uncorrelated. Once method factors in the context of ability testing are interpreted it frequently turns out that those method factors might also express individual differences in methods and given the ubiquitous positive manifold amongst ability measures considering these method factors to be orthogonal to other ability factors is implausible. To sum up, in order to ascertain equivalence of data across media in the within-subject-model it is pivotal to check if the introduction of a method factor is required.
In the between-subject-design an extension of CFA – the multi-group confirmatory factor analysis (MGCFA) – is a suitable method to check for equivalence of test data gathered with different test media. If you look on the (overarching) CFA approach in terms of a regression model the prediction of the observed score y for a person j contingent on the latent ability level η through an indicator i on a medium m is described by Y(i,m,j) = τ(i,m) + λ(i,m) ∙ η(m,j) + ε(i,m,j), where τ is the intercept, λ is the factor loading and ε is the residual term. In order to guarantee measurement invariance all these variables have to be equal across test media conditions.
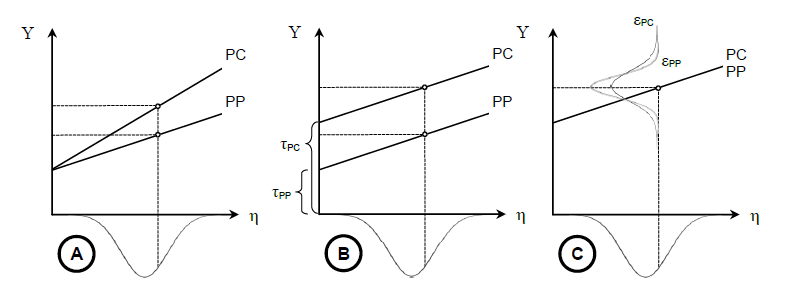
Figure 2. The consequence of divergent measurement parameters on the observed score. Note, that there is a perfect overlap between the ability distributions in both conditions.
Consider another example of a paper-based test measuring crystallized intelligence. The test is transferred to computers and the researcher is confronted with the question of equivalence of the test across media. The three graphs in figure 2 describe various possible scenarios of measurement invariance for the crystallized intelligence test administered on both media, PP and PC. In the first graph (A) the subtests differ with regard to their slope or factor loadings (λ(i,PP) > λ(i,PC)). In the second graph (B) the difference lies in the intercepts (τ(i,PP) > τ(i,PC); the difference between the intercepts amount to the level of overprediction or underprediction. This situation of constant over- or underprediction independent of the ability level is referred to as uniform bias (Mellenbergh, 1982). In the third graph (C) the variance around the expected value is unequal implying different variances in the residual term (ε(i,PP) ≠ ε(i,PC)). Even though the underlying ability distribution in both groups is the same, unequal model parameters cause differences in the observed scores or, put differently, produce measurement invariance or non-equivalence. A straight forward procedure to assess the level of equivalence across test media is to compare four models in a fixed order, from the least to the most restrictive model.
Table 1. Multi-group confirmatory factor analysis (MGCFA): Testing for equivalence in a between-subject-design
| Continuous variables | Loadings | Intercepts | Residuals | Means |
|---|---|---|---|---|
| Configural invariance | * | * | * | Fixed at 0 |
| Weak factorial invariance | Fixed | * | * | Fixed at 0 |
| Residual variance invariance | Fixed | * | Fixed | Fixed at 0 |
| Strict factorial invariance | Fixed | Fixed | Fixed | Fixed at 0/* |
Note. The asterisk (*) indicates that the parameter is freely estimated. Fixed = the parameter is fixed to equity across groups; Fixed at 0 = factor means are fixed to 0 in both groups. Fixed at 0/* = factor means are fixed to 0 in the first group and freely estimated in all other groups.
Table 1 lists the different steps in invariance testing. In step 1, testing for configural invariance, all measurement parameters (factor loadings, residual variances, and intercepts) are freely estimated in both conditions (PP and PC). In step 2, metric invariance, models are invariant with respect to their factor loadings whereas all other parameters (residual variances and intercepts) are freely estimated. If measurement invariance is established on this stage, administration mode does not affect the rank order of individuals. This condition is also referred to as metric or weak invariance and is a prerequisite for meaningful cross-group comparisons (Bollen, 1989). In step 3, residual variance invariance, on top of the restrictions in step 2 the residual variances between groups are fixed to equality. In the most restrictive model (step 4) all measurement parameters are equal. If this standard is met strict factorial invariance (Meredith, 1993) holds. Wicherts (2007) explains why – in the last step in testing for strict equivalence – it is essential to allow for differences in factor means while fixing the intercepts to equality. Neglecting this possibility would force any factor mean difference in the group into differences in the intercepts, thus, concealing group differences. Each of the above models is nested within the previous ones, for example, model C derives from model B by imposing additional constraints. Because of this nested character a potential deterioration in model fit is testable through a Chi-square-difference-test. Cheung and Rensvold (2002) evaluated different goodness-of-fit indices with respect to a) their sensitivity to model misfit and b) dependency on model complexity and sample size. Based on a simulation they recommend using Δ(Gamma hat) and Δ(McDonald’s noncentrality index) in addition to Δ(CFI) in order to evaluate measurement invariance. Although multi-group models are the method of choice in the between-subject scenario there are some interesting issues concerning: a) effect-sizes, b) location of invariance violation, c) application to ordinal measures, c) application to ordinal measures, and d) the modeling of non-invariance (Millsap, 2005).
Discussion
In this chapter two methods have been presented that have a series of advantages over non-factorial approaches and clearly are more adequate than procedures frequently applied in the literature. In this discussion we want to focus on some heuristics on what can be done to achieve equivalence prior to collecting data? Because the testing is influenced by both software (e.g., layout design) and hardware aspects (e.g., display resolution) much effort has been devoted to answer this question from a technological perspective, for example, about the legibility of online texts depending on font characteristics, length and number of lines, and white spacing (cp. Leeson, 2006). Bearing in mind the rapid changes in soft- and hardware it seems hard to give long-lasting advice. Nevertheless, when you are testing on a variety of computers (e.g., using school facilities or testing unproctored via the Internet) try to implement a test environment that is independent of a specific operating system. In order to exclude as few candidates as possible keep the technical aspects of the testing simple. From a psychological perspective chances are enhanced to establish equivalence across test media if the PC-condition is handled and as thoroughly scrutinized as a parallel paper-based test form. However, even a sound construction does not immunize against violations of stronger forms of equivalence. In this case it is inevitable and advisable to account for the additional source of variance. One way to accomplish this is to survey potential moderators like computer experience, accessibility to computers, and hands-on skills. However, as long as we do not know exactly why essential properties of ability measures vary across test media, investigating the equivalence of computer- and paper-based test data is critical.
References
- American Educational Research Association (AERA), American Psychological Association (APA), & National Council on Measurement in Education (NCME). (1999). Standards for educational and psychological testing. Washington, DC: American Educational Research Association.
- Bollen, K. A. (1989). Structural equations with latent variables. Oxford, England: John Wiley & Sons. https://doi.org/10.1002/9781118619179
- Cheung, G. W., & Rensvold, R. B. (2002). Evaluating goodness-of-fit indexes for testing measurement invariance. Structural Equation Modeling, 9, 233–255. https://doi.org/10.1207/S15328007SEM0902_5
- Drasgow, F., & Kanfer, R. (1985). Equivalence of psychological measurement in heterogeneous populations. Journal of Applied Psychology, 70, 662-680. https://doi.org/10.1037//0021-9010.70.4.662
- Eid, M. (2000). A multitrait–multimethod model with minimal assumptions. Psychometrika, 65, 241–261. https://doi.org/10.1007/BF02294377
- Eid, M., Lischetzke, T., Nussbeck, F. W., & Trierweiler, L. I. (2003). Separating trait effects from trait-specific method effects in multitrait-multimethod models: A multiple-indicator CT-C(M-1) model. Psychological Methods, 8, 38-60. https://doi.org/10.1037/1082-989X.8.1.38
- Gallagher, A., Bridgeman, B., & Cahalan, C. (2002). The effect of computer-based tests on racial-ethnic and gender groups. Journal of Educational Measurement, 39, 133-147. https://doi.org/10.1111/j.1745-3984.2002.tb01139.x
- Gleser, L. J., & Olkin, I. (1994). Stochastically dependent effect sizes. In H. M. Cooper, & L. V. Hedges (Eds.), The handbook of research synthesis (pp. 339-355). New York: Sage.
- Goldberg, A. L., & Pedulla, J. J. (2002). Performance differences according to test mode and computer familiarity on a practice Graduate Record Exam. Educational & Psychological Measurement, 62, 1053-1067. https://doi.org/10.1177/0013164402238092
- Horkay, N., Bennett, R. E., Allen, N., & Kaplan, B. (2005). Online assessment in writing. In B. Sandene, N. Horkay, R. E. Bennett, N. Allen, J. Braswell, B. Kaplan, & A. Oranje (Eds.), Online assessment in mathematics and writing: Reports from the NAEP Technology-Based Assessment Project (NCES 2005-457). Washington, DC: U.S. Department of Education, National Center for Education Statistics.
- Kim, J.-P. (1999). Meta-analysis of equivalence of computerized and P&P tests on ability measures. Paper presented at the annual meeting of the Mid-Western Educational Research Association, Chigaco, IL.
- Leeson, H. V. (2006). The mode effect: A literature review of human and technological issues in computerized testing. International Journal of Testing, 6, 1-24. https://doi.org/10.1207/s15327574ijt0601_1
- Lubke, G. H., Dolan, C. V., Kelderman, H., & Mellenbergh, G. J. (2003). On the relationship between sources of within- and between-group differences and measurement invariance in the common factor model. Intelligence, 31, 543-566. https://doi.org/10.1016/S0160-2896(03)00051-5
- Marsh, H. W., & Grayson, D. (1995). Latent Variable Models of Multitrait-Multimethod Data. In R. H. Hoyle (Ed.), Structural Equation Modeling (pp. 177-198). Thousand Oaks: Sage.
- Mead, A. D., & Drasgow, F. (1993). Equivalence of computerized and paper-and-pencil cognitive ability tests: A meta-analysis. Psychological Bulletin, 114, 449-458. https://doi.org/10.1037/0033-2909.114.3.449
- Mellenbergh, G.J. (1982). Contingency table models for assessing item bias. Journal of Eduactional Statistics, 7, 105-118. https://doi.org/10.3102/10769986007002105
- Meredith, W. (1993). Measurement invariance, factor analysis and factorial invariance. Psychometrika, 58, 525-543. https://doi.org/10.1007/BF02294825
- Millsap, R. E. (2005). Four Unresolved Problems in Studies of Factorial Invariance. In A. Maydeu-Olivares, & J. J. McArdle (Eds.), Multivariate applications book series. Contemporary psychometrics: A festschrift for Roderick P. McDonald (pp. 153-171). Mahwah, NJ, US: Lawrence Erlbaum Associates Publishers.
- Neuman, G., & Baydoun, R. (1998). Computerization of paper-and-pencil tests: When are they equivalent? Applied Psychological Measurement, 22, 71-83. https://doi.org/10.1177/01466216980221006
- Overton, R. C., Taylor, L. R., Zickar, M. J., & Harms, H. J. (1996). The pen-based computer as an alternative platform for test administration. Personnel Psychology, 49, 455-464. https://doi.org/10.1111/j.1744-6570.1996.tb01808.x
- Wang, S., Jiao, H., Young, M. J., Brooks, T., & Olson, J. (2007). A meta-analysis of testing mode effects in grade K-12 mathematics tests. Educational and Psychological Measurement, 67, 219-238. https://doi.org/10.1177/0013164406288166
- Wang, S., Jiao, H., Young, M. J., Brooks, T., & Olson, J. (2008). Comparability of computer-based and paper-and-pencil testing in K 12 reading assessments: A meta-analysis of testing mode effects. Educational and Psychological Measurement, 68, 5-24. https://doi.org/10.1177/0013164407305592
- Wicherts, J. M. (2007). Group differences in intelligence group performance. Unpublished doctoral dissertation, University of Amsterdam, Amsterdam.
- Widaman, K. F. (1985). Hierarchically nested covariance structure models for multitrait-multimethod data. Applied Psychological Measurement, 10, 1-26. https://doi.org/10.1177/014662168500900101
- Wilhelm, O. (2005). Measuring reasoning ability. In O. Wilhelm, & R. W. Engle (Eds.), Understanding and measuring intelligence (pp. 373-392). London: Sage. https://doi.org/10.4135/9781452233529.n21